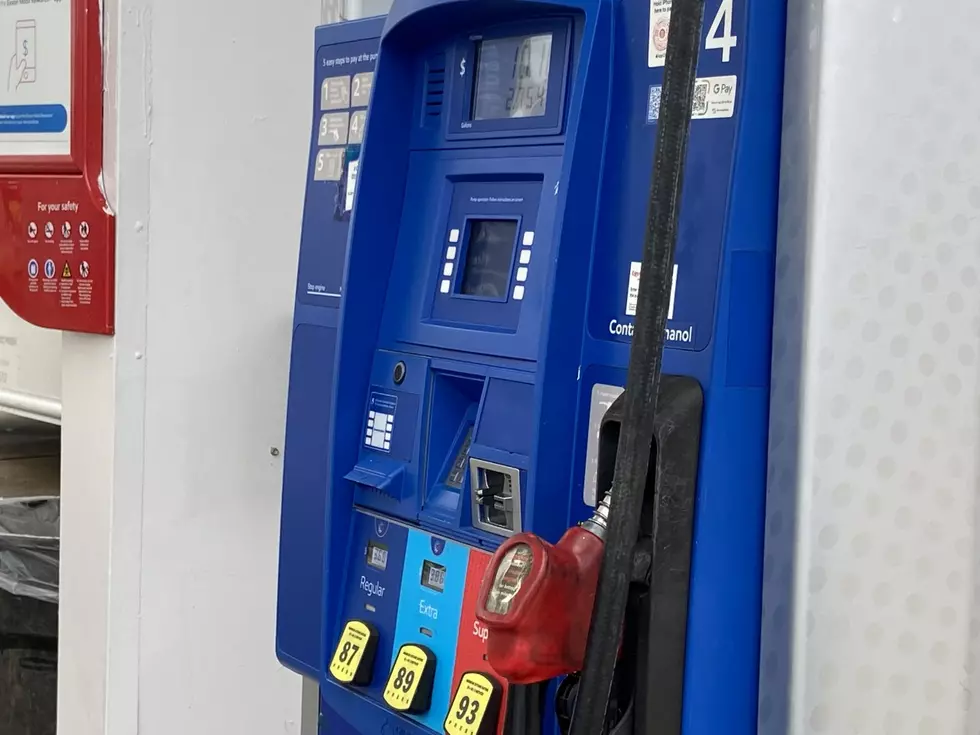
Gas Prices at Lowest Level in 20 Years
Gas prices are down considerably all across the nation. The last time we were paying under $1.40 was back in 1999 when we were paying $1.22. The most expensive year was 2012 when we were paying $3.69 on average for the year.

Inflation Adjust Gasoline Prices (1978-2017)
| Year | Average Annual Gas Prices (In Dollars)* | Average Annual CPI for Gasoline** | Gas Prices Adjusted for Inflation (In 2017 Dollars) |
| 1978 | 0.652 | 51.900 | 2.659 |
| 1979 | 0.882 | 70.200 | 2.660 |
| 1980 | 1.221 | 97.500 | 2.653 |
| 1981 | 1.353 | 108.500 | 2.640 |
| 1982 | 1.281 | 102.800 | 2.638 |
| 1983 | 1.225 | 99.400 | 2.609 |
| 1984 | 1.198 | 97.800 | 2.593 |
| 1985 | 1.196 | 98.600 | 2.568 |
| 1986 | 0.931 | 77.000 | 2.561 |
| 1987 | 0.957 | 80.100 | 2.530 |
| 1988 | 0.964 | 80.800 | 2.525 |
| 1989 | 1.060 | 88.500 | 2.537 |
| 1990 | 1.217 | 101.000 | 2.552 |
| 1991 | 1.196 | 99.200 | 2.554 |
| 1992 | 1.190 | 99.000 | 2.545 |
| 1993 | 1.173 | 97.700 | 2.542 |
| 1994 | 1.174 | 98.200 | 2.532 |
| 1995 | 1.205 | 99.800 | 2.558 |
| 1996 | 1.288 | 105.900 | 2.575 |
| 1997 | 1.291 | 105.800 | 2.585 |
| 1998 | 1.115 | 91.600 | 2.579 |
| 1999 | 1.221 | 100.100 | 2.583 |
| 2000 | 1.563 | 128.600 | 2.573 |
| 2001 | 1.531 | 124.000 | 2.615 |
| 2002 | 1.441 | 116.000 | 2.630 |
| 2003 | 1.638 | 135.100 | 2.567 |
| 2004 | 1.923 | 159.700 | 2.550 |
| 2005 | 2.338 | 194.700 | 2.543 |
| 2006 | 2.635 | 219.900 | 2.537 |
| 2007 | 2.849 | 237.959 | 2.536 |
| 2008 | 3.317 | 277.457 | 2.532 |
| 2009 | 2.401 | 201.555 | 2.522 |
| 2010 | 2.836 | 238.594 | 2.517 |
| 2011 | 3.577 | 301.694 | 2.510 |
| 2012 | 3.695 | 311.470 | 2.512 |
| 2013 | 3.584 | 302.577 | 2.508 |
| 2014 | 3.425 | 290.889 | 2.493 |
| 2015 | 2.510 | 212.007 | 2.507 |
| 2016 | 2.204 | 187.602 | 2.487 |
| 2017 | 2.469 | 211.770 | 2.469 |
*Data Source: U.S. Bureau of Labor Statistics: 12-Month Average Gasoline, all types, per gallon/3.785 liters in U.S. city average, average price, not seasonally adjusted.
If you check out Gas Buddy, you can find some stations selling fuel for $1.09 in the New Orleans area.
Some Scenes from the Great Depression
More From News Radio 710 KEEL